Key features of Redmine Graphs & Charts Statistics Plugin by RedmineX
Visualization of Redmine Data
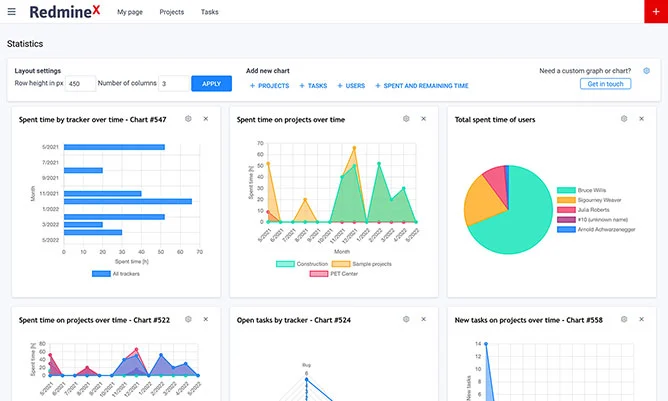
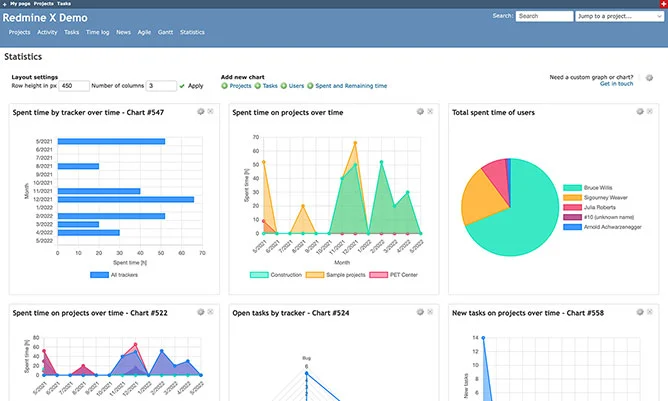
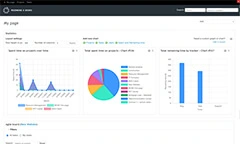
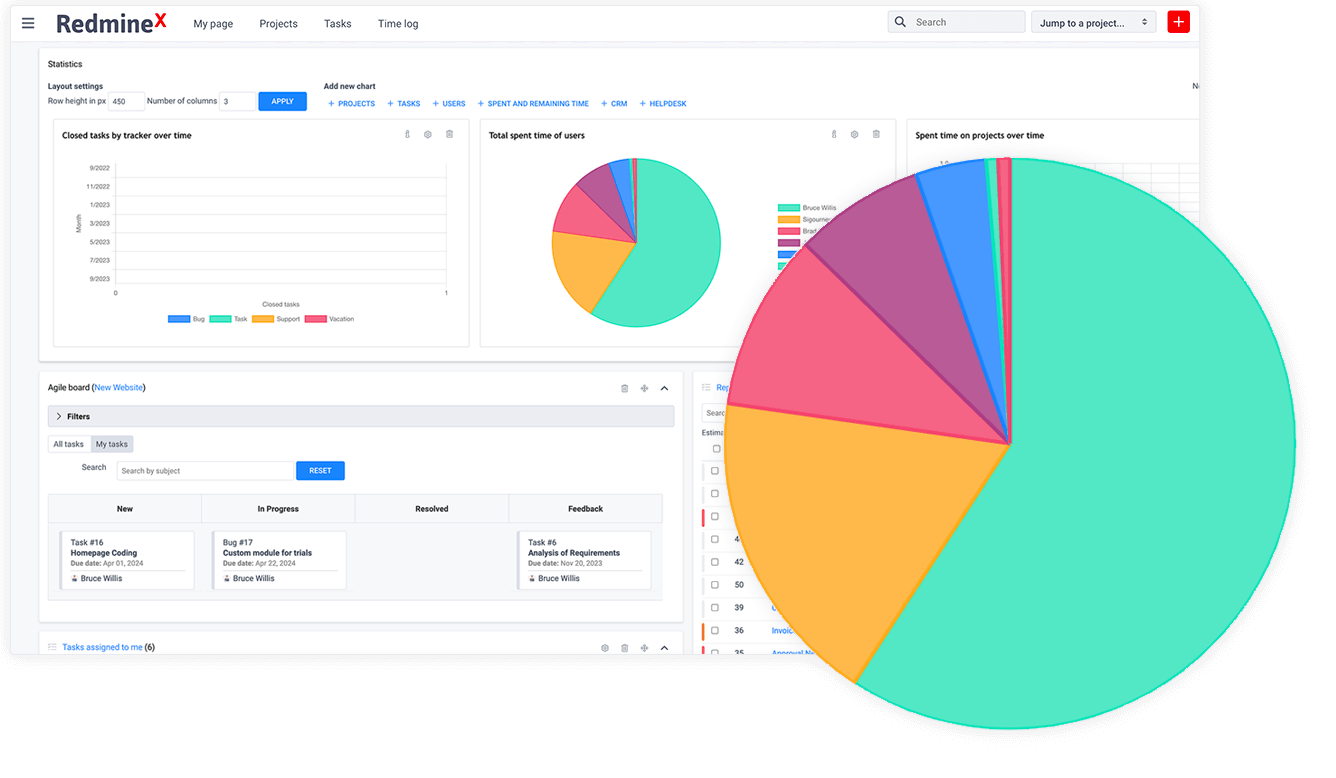
Any Redmine data can be easily visualized in eye-candy graphs & charts using this Redmine Plugin. There are more than 22 predefined charts showing data about your projects, tasks, users, spent time, and estimated time.
Global & Project-level Statistics Dashboard
There is a global statistics dashboard that shows graphs & charts based on all Redmine data. Moreover, each project can have its own statistics dashboard that shows project data only.
Predefined Graphs & Chart For The Most Common Statistics
There are predefined charts for all essential Redmine entities such as projects, tasks, trackers, users, activities, priorities, spent time, and estimated time.
Easy Customization Of Any Chart
Every chart has settings so you can show entities you want and time ranges. You can define the legend position to best visualize the graph data, or choose a palette if there are too many charts of the same color.
Custom Graphs & Charts Development
If you are missing a particular graph, or chart, you can order it right within the statistics view. We will send you a quote within 24 hours. This is a one-o-a-kind on-demand feature never seen in a Redmine plugin before.
Plugin
Redmine 4.1.x - 5.x
Bitnami
100% Open Source

 Redmine 4.1.x - 5.x (default Redmine)
 Bitnami